

Your workforce may look healthy against national averages while carrying higher levels of risk than comparable employers. Without that sector context, HR and wellbeing leaders can underestimate important health risks, set unsuitable targets and direct limited budgets towards the wrong priorities. Sector benchmarking reveals where your workforce differs from its peers – and where action is most needed.
Why national averages can hide workforce health risks
Most HR and wellbeing leaders know their workforce faces health risks. The challenge is deciding where to act.
Resources are limited, budgets are scrutinised and wellbeing initiatives are increasingly expected to deliver measurable outcomes. Yet many organisations lack the context they need to establish clear priorities.
Research published by the Institute for Public Policy Research (IPPR) estimates that poor health costs UK businesses more than £100 billion annually. But this headline figure cannot tell an individual employer which health risks are most relevant to its workforce or where investment is most needed.
Many organisations rely on national statistics to guide their wellbeing strategies. Depending on the source, population-level averages can include retirees, students and people outside the workforce. They provide a broad picture on the nation’s health, but they do not necessarily reflect the working population or the conditions within a particular industry.
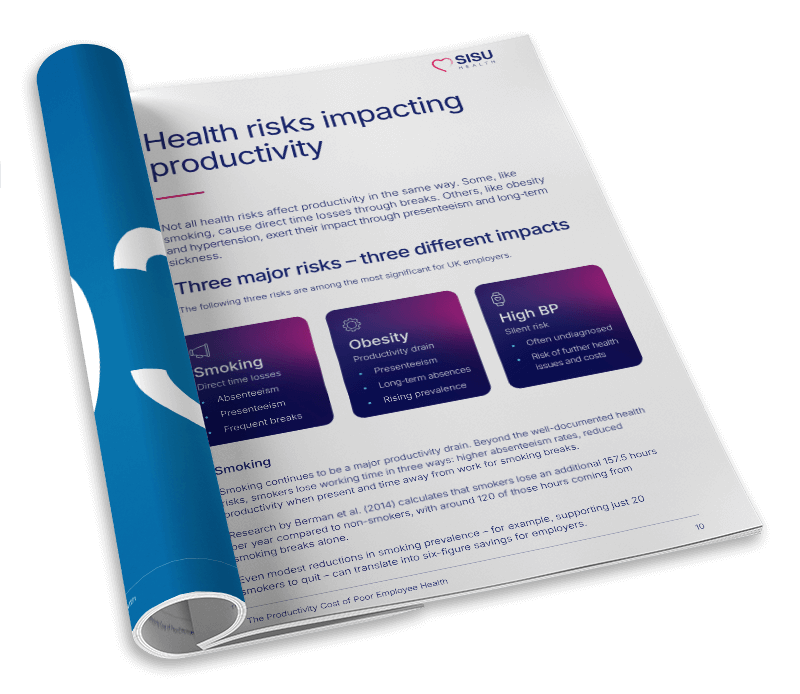
As highlighted in our eBook, The Productivity Cost of Poor Employee Health, SISU Health’s workplace health data gathered over the past two years shows measurable differences between workforce and population-level figures:
| Health Risk | General UK population | SISU Health workforce data |
|---|---|---|
| Smoking | 11.9% | 13.1% |
| Obesity (BMI ≥30) | 29% | 28.5% |
| Overweight (BMI ≥25) | 64.9% | 65.6% |
| High blood pressure | 30% | 15% |
National averages tell you what is happening across the population. Workforce data shows what is happening among employees, while sector-level benchmarking adds another important layer by showing how an organisation compares with employers operating in a similar environment.
Turn workforce health data into strategic impact
Discover hidden workforce health costs and get a ready-to-use guide to build a business case for prevention.
What sector benchmarks reveal that national data cannot
Every industry has its own health risk profile, and the differences can be significant.
Analysis of more than 300,000 workforce health checks shows that the average employee risk load can vary by up to 50% between sectors. The differences are also visible within individual health risks, including elevated BMI and high blood pressure.
| Health Risk | UK working-age benchmark | Transportation sector* | Energy sector* | Consumer durables & apparel sector* |
|---|---|---|---|---|
| High BMI / Obesity | 64.6% | 70% | 72% | 64% |
| High blood pressure | 30% | 19% | 19% | 15% |
| Smoking | 11.9% | 15% | 11% | 19% |
*Analysis based on data collected by SISU Health from 10 Dec 2014 – 3 Sept 2026.
This comparison shows why national data alone can be misleading. A workforce may sit close to the national average overall while recording much higher levels of a particular risk than other employers in its sector.
Conversely, a risk that initially appears high may be typical for comparable workforces – changing the target an organisation sets and the way progress should be assessed.
A workforce can look average against national data and still be an outlier within its own sector.
Three ways sector benchmarking improves wellbeing decisions
Sector benchmarking gives HR and wellbeing leaders context that national averages cannot. It supports better decisions in three important areas.
1. Identify risks national averages can hide
A workforce might appear “average” when compared with national figures while still having a higher prevalence of particular risks than similar employers.
For example, SISU Health’s sector data shows that the prevalence of high blood pressure and elevated BMI can be up to 40% higher in Transport and Manufacturing workforces than the UK working-age average. Without sector context, employers may not recognise the scale of those risks or the case for earlier intervention.
2. Set targets that reflect your sector
A logistics business should not rely on the same baseline as a software company. Sector data provides a more relevant view of what is typical and what strong performance could look like within a particular industry.
This helps organisations set realistic improvement targets, measure progress against an appropriate comparator and demonstrate whether their approach is making a meaningful difference over time.
3. Focus investment on the clearest needs
Benchmarking shows which health risks are most prevalent within a sector and where an individual workforce differs from its peers. This helps organisations focus finite wellbeing budgets on the areas with the clearest need.
In the Automobiles & Components sector, for example, our analysis shows an average productivity loss of £1,282 per employee each year. Identifying the health risks contributing most to that cost helps employers decide which interventions should take priority.
Combine sector benchmarks with your own workforce data
A benchmark does not prescribe a wellbeing strategy on its own. Its value comes from combining a relevant sector comparison with an organisation’s own anonymised workforce health data.
Together, those insights can help leaders answer practical questions:
- Which health risks are more prevalent in our workforce than among comparable employers?
- Are particular sites or workforce groups underrepresented in health check participation?
- Where should we focus intervention, and which measures should we track over time?
This moves benchmarking beyond a general comparison. It provides a clearer basis for prioritising action, setting targets and assessing whether investment is improving workforce health.
See your workforce health in context with SISU Health
SISU Health gives organisations access to workforce data and sector benchmarks needed to understand where their health risks sit and how they compare with similar employers.
Drawing on one of the UK’s largest employee health datasets, our reporting dashboards and benchmarking tools allow leaders to identify the most prevalent risks, compare their workforce with relevant sector benchmarks and monitor change over time.
This gives HR and wellbeing teams a clearer basis for setting priorities, measuring progress and building the case for investment with senior leaders and boards.
If you would like to understand how your workforce compares, talk to our team. We can help you identify where health risks are higher than expected, which areas warrant closer attention and what to track over time.
Key takeaways
- National averages provide useful background, but they do not necessarily reflect the health risks within a particular workforce or industry.
- SISU Health data shows that average employee risk loads can vary by as much as 50% between sectors.
- Comparing with relevant sector peers can uncover unexpected risks, support more realistic targets and guide investment decisions.
- Benchmarking is most valuable when it is combined with an organisation’s own workforce health data and used to track change over time.
Next steps
- Download The Productivity Cost of Poor Employee Health: Explore how workforce health risks affect productivity and how to build the financial case for targeted wellbeing investment.
- Read Building a Business Case for Wellbeing That Wins Board Approval: Learn how to use workforce health insight to quantify risk, demonstrate potential return and strengthen the case for investment.
- Download The State of Workforce Health 2025 report: Explore findings from more than 100,000 workplace health checks, including how risks vary between sectors, age groups and workforce populations.
Sources
- Department of Health and Social Care (2025). Obesity, physical activity and nutrition. Available at: https://fingertips.phe.org.uk/profile/obesity-physical-activity-nutrition/data#page/4
- Wastell, D., Evans, L., Horsfall, G., (2024). Hidden annual cost of employee sickness is up to £30 billion since 2018. Institute for Public Policy Research (IPPR). Available at: https://www.ippr.org/media-office/revealed-hidden-annual-cost-of-employee-sickness-is-up-30-billion-since-2018
- NHS Digital (2026) Health Survey for England, 2024. Available at: https://digital.nhs.uk/data-and-information/publications/statistical/health-survey-for-england/2024/adults-health


Turn workforce wellbeing into measurable results
Learn how we help employers reduce hidden health costs, boost productivity and improve employee wellbeing.